We can all agree that accurately tracking carbon emissions is crucial, yet complex.
This guide will clearly walk you through the basics of monitoring your organisation's climate impact, from key terminology to reporting methodologies, empowering even sustainability beginners with essential carbon accounting skills.
You'll gain insight into major emissions data sources, calculation frameworks, reduction goal-setting, and tips for streamlining tracking over time through automation and verification controls.
Introduction: Navigating the Essentials of Tracking Carbon Emissions
This section provides background on carbon emissions, climate change, and why emissions tracking is becoming increasingly important for businesses aiming to reduce their environmental impact.
The Basics of Carbon Footprints and Their Global Significance
- A carbon footprint measures the total greenhouse gas (GHG) emissions caused directly and indirectly by an individual, organisation, event or product. It is measured in tonnes of carbon dioxide equivalent (tCO2e).
- Tracking carbon emissions allows us to quantify impacts, identify high-emission activities, and take focused action to reduce environmental damage.
- With atmospheric CO2 levels over 50% higher than pre-industrial times, the Earth's average temperature has already increased by 1°C. This is causing noticeable climate change effects like melting polar ice caps, rising sea levels, and more extreme weather.
Climate Accountability: The Corporate Role in Mitigating Impact
- Research shows the corporate world accounts for over 70% of global GHG emissions. This creates a responsibility to limit and reduce outputs.
- Consumers and investors now demand ethical business practices and rewards companies with strong ESG performance. Tracking and disclosing emissions data is key to this.
- Lowering environmental footprint directly limits climate change risks. This protects long-term profitability as ecological damage causes financial instability.
The Imperative of Emissions Tracking and Reporting
- Measuring carbon footprint allows you to establish a baseline, then set and track progress towards emission reduction targets.
- Detailed analytics identify the biggest areas to focus change efforts for maximum impact.
- Reporting and disclosing emissions data demonstrates accountability to consumers and stakeholders.
Evolving Standards: Navigating Regulatory and Voluntary Emissions Frameworks
- Regulators globally are enacting more sustainability disclosure laws. These require companies to measure and publicly share emissions data. Examples include the EU's CSRD and the US's proposed CLIMA Act.
- Voluntary reporting programs like CDP and the Climate Disclosure Standards Board also incentivise transparency. Membership signals positive ESG performance to investors.
- Using consistent measurement methodologies like the GHG Protocol brings credibility and allows benchmarking.
So in summary, deeply understanding your carbon footprint through accurate tracking allows strategic business decisions for long-term ethical and financial sustainability.
How do companies track their carbon emissions?
Tracking carbon emissions starts with conducting a carbon audit. This involves analysing your company's consumption data to identify the sources of your greenhouse gas (GHG) emissions.
Once you know where your emissions come from, you can start to measure and track them over time. Common sources of emissions for companies include:
- Energy use - Burning fossil fuels like natural gas or fuel oil to power facilities and operations generates carbon dioxide and other GHGs. Tracking usage and emissions factors for electricity and fuels provides the data needed.
- Transportation - Burning gasoline and diesel in company vehicles directly emits GHGs. Tracking fuel consumption provides the necessary data.
- Supply chain - Manufacturing and transporting goods purchased from suppliers often involves significant GHG emissions. Working with suppliers to gather emissions data allows companies to track these supply chain emissions.
Regularly collecting and analysing emissions data is key to tracking progress over time. Cloud-based carbon accounting software like EcoHedge Automated Lifecycle can automatically roll up emissions data from across the company into a single centralised platform. This eliminates manual data collection and provides the accurate, real-time analytics needed to track emissions effectively.
By conducting a thorough carbon audit and implementing ongoing emissions tracking, companies can monitor their carbon footprint over time and identify opportunities to reduce it. This positions them to set science-based emissions targets and make progress on their net zero journeys.
Side note: how do you actually detect carbon emissions?
Carbon dioxide molecules can be detected and measured in several ways. The most common methods utilise sensors based on nondispersive infrared (NDIR) or electrochemical technologies.
NDIR Sensors
NDIR sensors are currently the predominant solution for accurately measuring CO2 across a wide range of concentrations. They utilise an infrared light source directed through a sampling chamber towards an infrared detector. As CO2 absorbs specific wavelengths of infrared light, the gas concentration can be determined by analysing fluctuations in the infrared absorption.
Improvements in optical filters and electronics have made NDIR sensors extremely versatile - they can measure CO2 levels ranging from a couple hundred parts per million (ppm) up to 100% concentration with high precision. This allows them to be used in applications like air quality monitors and leakage detectors. Their affordability has also enabled more widespread adoption.
Electrochemical Sensors
Electrochemical sensors provide an alternative approach to detecting CO2 by taking advantage of chemical reactions triggered by carbon dioxide. The gas diffuses through a permeable membrane to an electrolyte solution, which initiates an electrical signal proportional to the CO2 concentration.
While they can struggle with accuracy compared to NDIR sensors, electrochemical sensors tend to be smaller and draw less power. Their selectivity can be an advantage in environments with multiple background gases. Miniaturised versions are being researched for niche uses like detecting CO2 in exhaled breath.
In summary, technology improvements to NDIR and electrochemical sensors have increased the options for accurately measuring carbon dioxide emissions. NDIR's versatility across wide detection ranges have made it the most broadly adopted choice. However electrochemical alternatives continue to evolve for specialised use cases.
How do you track carbon intensity?
Tracking carbon intensity involves calculating the amount of carbon dioxide (CO2) emissions associated with business operations. This allows companies to understand their environmental impact and take steps to reduce emissions over time.
Here are some key ways businesses can track their carbon intensity:
- Calculate overall CO2 emissions from operations annually using methodologies like the Greenhouse Gas Protocol. This considers emissions from energy use, transportation, waste, etc.
- Determine emissions relative to revenue, also called carbon intensity. This measures emissions efficiency - emissions per dollar of revenue earned. Tracking this metric year-over-year shows progress in decoupling growth from emissions.
- Break down emissions by business unit, product line, facility, etc. This identifies the largest sources of emissions to focus reduction efforts.
- Use automatic emissions tracking software like EcoHedge to continuously collect emissions data across the company and generate customised reports. Software can track many types of emissions and integrate smoothly with existing systems.
Regularly assessing a company's carbon intensity over time is vital for setting science-based emissions targets and ensuring decarbonisation stays on track. Software tools simplify this complex task so sustainability managers can accurately track progress.
How do you calculate carbon emissions?
To calculate carbon emissions, there are a few key steps:
Determine your emission sources
First, you need to identify all applicable emission sources across your operations. This includes direct emissions from owned or controlled equipment and vehicles, indirect emissions from purchased electricity, and other indirect emissions from your supply chain. Common sources are facilities, fleet vehicles, purchased materials, business travel, waste, etc.
Collect activity data
Once emission sources are mapped, compile associated activity data like energy and fuel consumption, production output, miles travelled, etc. This provides the volume of activity that leads to carbon emissions. Units might be kWh of electricity, therms of gas, litres of fuel, tonnes of waste, and so on. Reliable data is essential for accurate carbon accounting.
Apply emissions factors
Emissions factors represent the greenhouse gas emitted per unit activity and convert your activity data into carbon equivalents based on source type. For example, 1 kWh of coal electricity may equate to 1 kg CO2e based on its factor. Emission factors come from reputable published sources like government agencies and are already adjusted for the global warming potential of each greenhouse gas.
Track changes over time
With your systems mapped, activity compiled, and factors applied, you can determine emissions for your chosen inventory boundary and period. Calculate total footprint as well as breakdowns by site, department, or category. Track emissions over time to assess performance and identify opportunities to reduce your climate impact.
Accurately measuring carbon emissions takes careful scoping and consistent methodology, but is foundational to managing and lowering company-wide emissions. Automated software can assist in streamlining calculation while ensuring consistency, transparency, and stakeholder engagement on progress to net zero.
sbb-itb-919600f
How to Calculate Carbon Footprint: Methodologies Unveiled
Organisations today face increasing pressure from stakeholders to measure, report on, and reduce their greenhouse gas (GHG) emissions. However, the process of tracking carbon emissions can seem complex for those just beginning their sustainability journey.
This section provides an introductory guide on recognised carbon accounting approaches, aimed at demystifying key concepts and methodologies for SME professionals new to this realm.
Comprehensive Guide to Emissions Measurement Frameworks
Several authoritative standards exist for calculating corporate carbon footprints. Adopting one of these globally accepted frameworks brings credibility and ensures alignment with common sustainability reporting practices.
The most widely used emissions measurement and target-setting methodologies include:
- The Greenhouse Gas (GHG) Protocol - Developed by the World Resources Institute (WRI) and World Business Council for Sustainable Development (WBCSD), the GHG Protocol serves as the accounting framework for nearly every major emissions reporting program globally. It covers the 6 major GHGs and categorises emissions into 3 scopes.
- ISO 14064 - An international standard that specifies principles and requirements for GHG inventories and verification at the organisational or project level. It aligns with the GHG Protocol scopes and principles.
- Science Based Targets initiative (SBTi) - Enables companies to set emissions reduction targets consistent with climate science. SBTi criteria builds upon the GHG Protocol scopes for target boundary setting.
Adopting a common carbon accounting methodology brings standardisation that enables benchmarking against industry peers and consistency across reporting periods. As sustainability reporting gains prominence, familiarity with these frameworks is essential.
Dissecting Emissions: Direct vs Indirect Sources
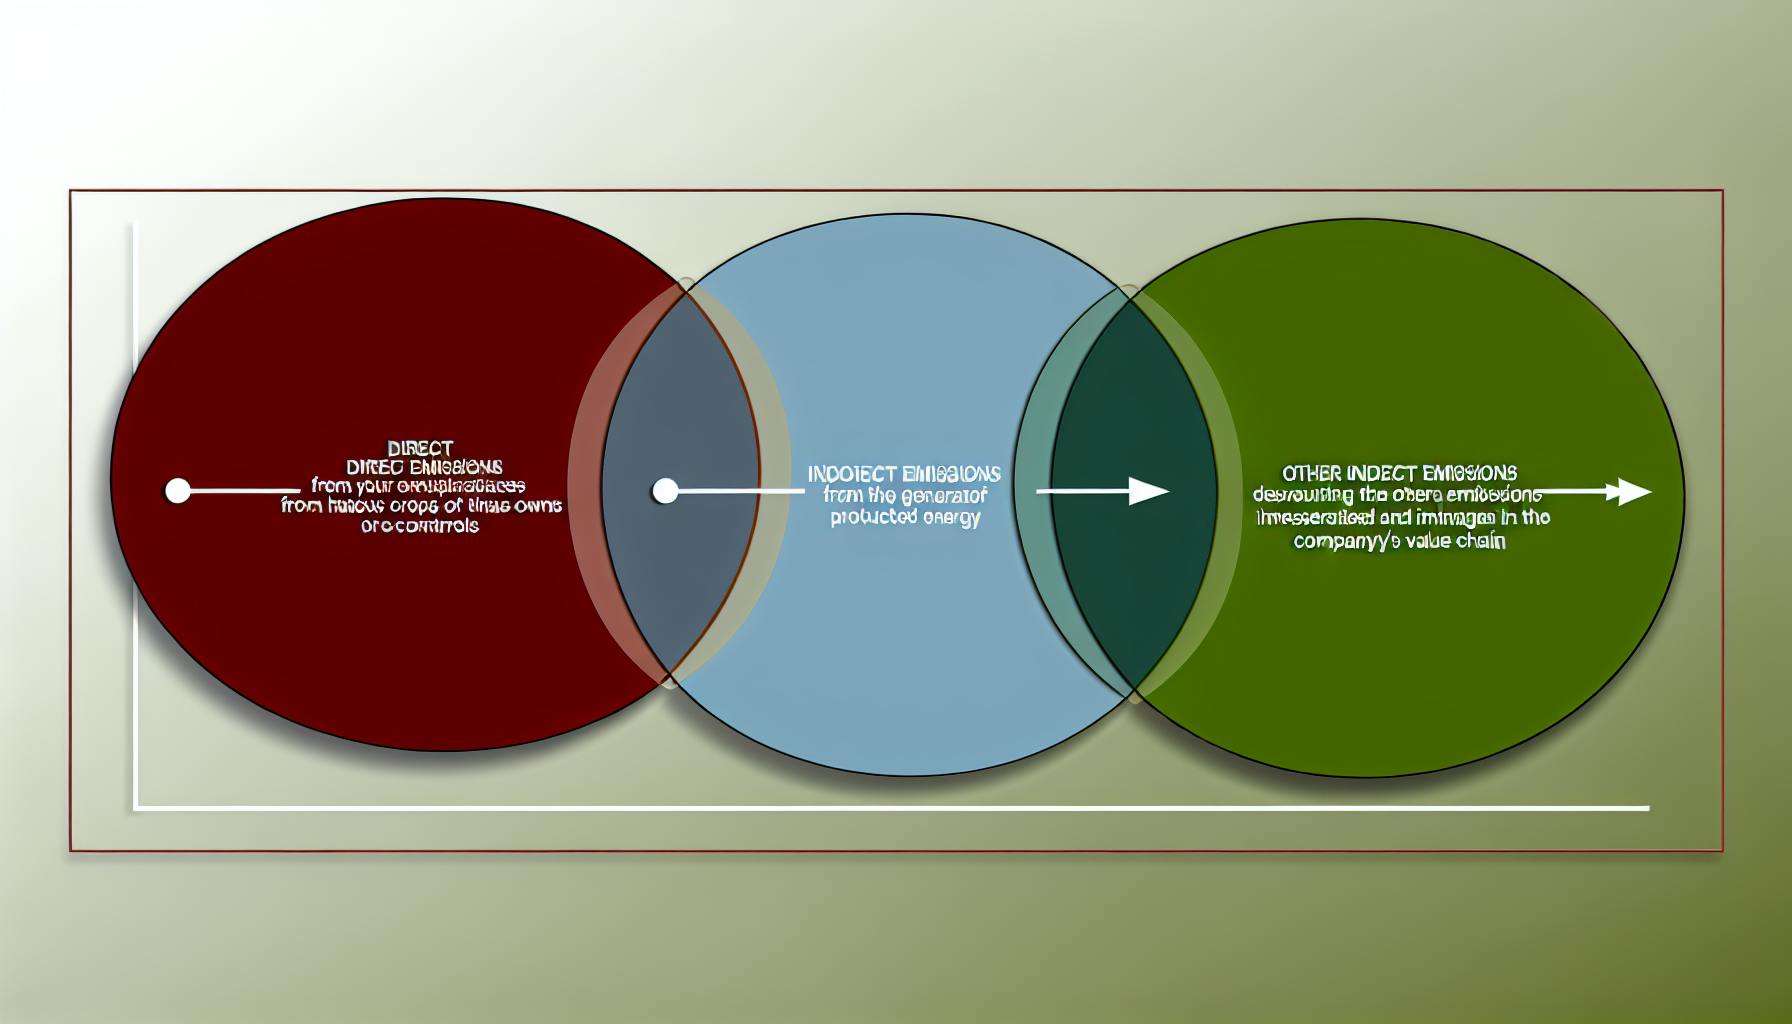
The GHG Protocol classifies emissions into 3 categories based on the degree of corporate control and ownership:
- Scope 1 - Direct emissions from sources owned or controlled by the company. This includes fuel combustion on-site, company vehicles, and industrial process emissions.
- Scope 2 - Indirect emissions from purchased electricity consumed by the company. Though not directly emitted, these emissions result from a company's energy usage.
- Scope 3 - All other indirect emissions occurring across a company's value chain. This encompasses emissions from business travel, procurement, waste disposal, investments, and more.
Distinguishing between direct and indirect emission sources is vital for properly accounting for a company's carbon footprint across Scopes 1, 2 and 3.
Determining Scope: Setting Organisational Emissions Boundaries
A key step when tracking carbon emissions involves determining which Scopes to include when setting disclosure boundaries. Several factors come into play:
- Operational Control - Emissions from operations under a company's financial or operational control must be included in their GHG inventory.
- Equity Share Approach - For joint ventures and partially owned entities, a company accounts for emissions proportional to their equity share.
- Materiality - Companies should account for indirect Scope 3 emissions that significantly contribute to total footprint. Material emissions warrant prioritisation.
- Value Chain Boundaries - Companies may report value chain emissions from indirect sources not financially accounted for, to provide a complete picture.
Defining inventory scopes and boundaries appropriately allows comprehensive emissions tracking aligned to stakeholder expectations. As sustainability matures into an integral business function, these scope settings hold increasing significance.
Balancing Act: Using Primary Data vs Estimates
When tracking carbon emissions, companies balance using primary emissions data from owned sources versus extrapolated estimations:
- Primary Data - Direct emissions measurements from continuous monitoring systems, lab testing or fugitive leak detection programs. Offers greatest accuracy.
- Estimates - Approximations using emissions factors, financial spend data or industry benchmarks. Used when direct measurement isn't feasible.
While primary data is ideal, limitations around metering and data accessibility necessitate using estimations to fill information gaps. Companies should maximise usage of quality primary data sources where cost-effective, while ensuring estimation methodologies are robust and provide representative results.
Over time, investing in improved data collection processes pays dividends through enabling more granular visibility into carbon outputs.
Consistency Over Time: The Art of Emissions Tracking
A final key consideration with tracking carbon emissions involves ensuring consistent boundary definitions, calculation methodologies and data usage over consecutive reporting years.
Why does this temporal consistency matter? Because accurately assessing performance on emissions reductions initiatives relies on the ability to compare against an organisationally-relevant baseline with standardised scope settings.
By institutionalising procedures that enable "like-for-like" comparisons of carbon inventories across time horizons, companies equip themselves to monitor progress and demonstrate credible, standards-aligned sustainability practices to stakeholders.
Data-Driven Decisions: Gathering Inputs for Emissions Calculations
Accurately tracking carbon emissions starts with gathering comprehensive data on all sources of greenhouse gas outputs across an organisation's operations. From energy usage to transportation, waste disposal to purchasing records, various data pillars provide the foundation for quantification and reporting.
This section explores sourcing the necessary inputs for emissions calculations, enabling data-driven decisions towards net zero. We'll highlight strategies and tools for efficient, tech-integrated tracking.
The Pillars of Carbon Data: Identifying Major Data Types
The first step is conducting an audit to identify all carbon emission sources, from electricity and fuel consumption to air miles travelled. Major data categories include:
- Energy usage logs from facilities and equipment like HVAC systems, appliances, IT infrastructure. Kilowatt-hours consumed across locations builds the energy footprint.
- Transportation records for fleet vehicles, employee commutes, business travel. Miles logged via planes, trains, and automobiles tabulate emissions.
- Supply chain data from procurement teams detailing expenditures on goods/services. Activities across the value chain contribute to overall footprint.
- Waste generation quantified by weight/volume for recycling streams, compost, landfill contributions. Disposal output ties to methane creation.
Compiling this data provides comprehensive inputs to calculate carbon emissions for sustainability reporting, like determining kg CO2e per functional area or revenue dollar.
Data Integration: Leveraging Existing Systems for Emissions Tracking
Instead of introducing new tracking mechanisms, integrating with current business systems can streamline data gathering for emissions purposes.
For example, connecting enterprise resource planning (ERP) software with sustainability platforms allows the automatic porting of expenditure records to quantify supply chain impacts.
Meanwhile travel & expense systems can sync passenger miles with carbon accounting tools to log air and ground transportation emissions.
API integrations with existing databases avoid manual datasets uploads for streamlined tracking.
Filling the Gaps: Initiating New Tracking Measures
However, existing infrastructure may have reporting gaps that require introducing additional monitoring to capture complete emissions data.
Common deficient areas include capturing energy reliably tied to specific locations, with smart metering analytics offering whole-building usage data for precision.
Likewise, new oversight on waste output by stream - weighed recycling of paper/plastic, compost levels, landfill contributions - provides clarity on methane generation.
IoT sensors can also fill data gaps, say attaching monitoring devices on fleet vehicles to improve fuel consumption or refrigerant leakage logging.
Assuring Accuracy: Verification and Quality Control in Data
With data sourced from across platforms and domains, applying scrutiny is essential to limit inaccuracies that distort total emissions calculations.
Spot checks on data validity, comparing samples against primary sources, can catch systemic reporting issues. Reviewing outliers also flags potential collection points requiring recalibration.
More rigorous third-party verification examines completeness and reliability in datasets, providing credibility in disclosures and strategic decision-making.
Tech-Savvy Tracking: Automation and Digital Tools for Efficiency
While sound data forms the foundation, collecting comprehensively at scale presents a challenge. This is where automation and digital tools shine by removing manual monitoring/spreadsheet burdens.
Smart sensors that transmit readings to the cloud power automated data gathering and analytics for real-time accuracy. Machine learning models also get smarter benchmarking usage.
Meanwhile, carbon accounting software readily handles multifaceted emissions calculations, keeps pace with reporting standards, and allows data imports through flexible API.
With informed data powering action, the path towards net zero clears. Comprehensive inputs drive strategic decisions - and progress made measurable. The next step is applying insights for targeted emission reductions across operations.
Interpreting the Numbers: From Carbon Data to Climate Strategy
With robust emissions data gathered from tracking carbon emissions across operations, we progress to quantification, contextualisation and planning. Incorporating carbon footprint examples illustrates potential outcomes from climate strategies.
Carbon Calculus: Emissions Totals and the Path to Normalisation
Quantifying absolute and relative carbon outputs compared to business size and growth contextualises the numbers. Key metrics like emissions per unit revenue or product shipped reveal carbon efficiency improvements amid business fluctuations.
Normalising by business activity indicators tracks how to calculate carbon footprint performance indicators over time. As an example, EcoHedge software visualises tCO2e per revenue or employee count, enhancing benchmarking.
Spotlight on Sustainability: Pinpointing Reduction Hotspots
Pinpointing priority areas across operations, supply chain and products ripe for intervention enables targeted carbon cuts. Carbon footprint calculator results spotlight the largest emissions sources.
For a typical firm, manufacturing and purchased goods constitute over 70% of emissions. Developing a supplier engagement program to track supply chain impacts offers major reduction potential.
Looking Back to Move Forward: Historical Trends and Benchmarking
Understanding carbon performance over time and against industry peers via benchmarking provides essential context for target-setting.
EcoHedge software visualises historical emissions trends by source and scope. Comparing against peers on metrics like tCO2e per unit of product benchmarks progress.
These insights help firms set science-based targets, aligning with 1.5°C pathways.
Predicting the Future: Forecasting Emissions and Scenario Modeling
Estimating future emissions via models and scenarios shapes strategy and aids investment decisions for reaching set targets.
EcoHedge builds automated emissions forecasts based on growth projections. Models estimate impacts of interventions like renewable energy adoption or supply chain changes.
Scenarios contrast outcomes of varying climate action ambition, assisting plans to reach science-aligned goals.
Target Practice: Setting Actionable Carbon Reduction Goals
Applying learnings into concrete emission reduction goals catalyses meaningful carbon cuts. EcoHedge sets customised, science-based targets.
Companies ought to stress test goals against future uncertainties using scenario analysis. Regular tracking and transparent reporting builds accountability towards ambitions.
Setting actionable, granular goals per department drives engagement. With robust data inputs, reduction opportunities become apparent, enabling progress.
Carbon Progress Check: Monitoring and Reporting Sustainability Achievements
Regularly checking in on carbon emissions progress is key for businesses aiming to achieve net-zero goals over the long term. By establishing data tracking routines, investing in automation, adapting baseline targets, and embracing transparency, companies can monitor performance improvements and effectively communicate sustainability achievements.
Keeping Score: Establishing a Routine for Carbon Data Collection
To keep emissions reduction efforts on track, tracking carbon emissions should become part of standard business processes. Appropriate regularity for measurements varies based on factors like business size, emissions volatility, and inventory cycles. More consistent data creates accuracy, while less frequent full analyses balance practicality. Most experts recommend comprehensive annual assessments supplemented by lighter quarterly or monthly spot checks.
Strategically planning data collection cycles upfront enables proactive monitoring. Calibrating measurement routines to business cycles also aids context - for example, conducting complete carbon inventories after peak seasons or major events. Establishing set calendars for emissions checks and diagnoses ensures continuity even during busy periods.
Automating the Future: Streamlined Emissions Tracking
While strict tracking brings consistency, manual data gathering and number-crunching is time and labor intensive. The solution lies in automation tools. From integrated sensors gathering source usage statistics to software processing inventories, technology enables continuous emissions monitoring without repetitive heavy lifting.
Smart electric meter analytics, for example, provide regular power consumption data to feed automated calculations. Carbon accounting platforms like EcoHedge then digest usage inputs to determine updated footprints and trajectories. Built-in custom alerts trigger notifications of anomalous emissions spikes for rapid diagnosis. By removing manual work and human error risks from the tracking equation, automation allows focus on strategy rather than data wrangling.
Adjusting the Baseline: Adapting Targets to Business Evolution
Emissions reduction targets need periodic reassessment for continued relevance as operational contexts evolve. Growth, contractions, disasters, mergers, divestments etc. alter the emissions baseline. An outdated baseline skews data interpretations - what seems like progress could just be a proportionate footprint increase.
Resetting reference points when goals or business fundamentals shift is key. While past achievements always hold value, regularly updating baseline years and targets keeps carbon programs calibrated to present realities. This could mean ratcheting up goals after rapid expansions or relaxing temporary exceptions amidst crises.
The exercise also includes factoring in reductions from green energy transitions or efficiency investments when setting new bars. Updating baseline years through carbon data analytics platforms like EcoHedge allows updated target setting aligned with business transformations.
Open Book: Embracing Transparency with Regular Carbon Reporting
Public transparency in sustainability helps drive environmental action while increasing brand trust. Sharing emissions performance through annual reports or real-time digital trackers builds stakeholder awareness and accountability. It also demonstrates concrete climate commitment instead of generic green-washing claims.
Frequent, data-backed updates create credibility - especially when disclosing underperformance too. Investors and regulators also mandate climate risk disclosures nowadays, making transparency non-negotiable. Still, balance matters where competitive concerns exist. Publishing inventory specifics may not suit all organisations or emissions types.
Appropriate transparency levels depend on context. But regular reporting backed by rigorous measurements undoubtedly accelerates net-zero through trust and accountability.
In Retrospect: Reflecting on the Journey of Carbon Emissions Tracking
The path towards sustainability requires commitment, diligence, and accurate accounting. As discussed, tracking carbon emissions entails developing a deep understanding of key methodologies, terminology, and best practices. Though the process can seem daunting initially, taking that first step opens the door to critical insights that inform impactful climate action.
For SMEs just embarking on this journey, focus first on education and awareness. Get grounded in fundamental concepts like scopes, GHG inventories, and product lifecycles. Then assess your operations through an environmental lens, considering the impacts of raw material sourcing, transportation, energy use, and waste. Look for low hanging fruit – simple changes that significantly reduce emissions. Efforts like improving equipment efficiency, limiting business travel, or switching to renewable energy may have quick payoffs.[^1]
As your sustainability program matures, invest in robust tracking tools like ecohedge.com/">EcoHedge to measure your overall footprint. Quality data and benchmarking enable smarter strategies targeting more ambitious emission reduction goals. Don't be deterred by early hiccups or data gaps. Perfection is the enemy of progress when building an effective carbon accounting program.
The sustainability journey also necessitates engaging stakeholders through clear, consistent reporting on emissions and climate risk. Success depends on collaboration, accountability, and collective ambition to curb our impact. Though individuals alone cannot turn the tide, each small action ripples outwards to shape attitudes and behaviours within families, organisations, and society as a whole.
In closing, accurately tracking carbon emissions represents a critical first step that empowers climate action. The path forward undoubtedly brings challenges, but the view ahead is brighter for it. Let data, insights and shared purpose guide us towards a more sustainable tomorrow. The first step is often the most difficult, but also the most important. Onward.
[^1]: Tip: Installing energy-efficient lighting or optimising equipment utilisation schedules can significantly reduce Scope 2 emissions with minimal upfront costs. Look for quick wins to build momentum.